# 逐步指南
¥Step-by-step guide
按照本指南熟悉 Chart.js 的所有主要概念:图表类型和元素、数据集、自定义、插件、组件和 tree-shaking。不要犹豫,点击文本中的链接。
¥Follow this guide to get familiar with all major concepts of Chart.js: chart types and elements, datasets, customization, plugins, components, and tree-shaking. Don't hesitate to follow the links in the text.
我们将从头开始使用几个图表构建一个 Chart.js 数据可视化:
¥We'll build a Chart.js data visualization with a couple of charts from scratch:
# 使用 Chart.js 构建新应用
¥Build a new application with Chart.js
在新文件夹中,创建包含以下内容的 package.json 文件:
¥In a new folder, create the package.json file with the following contents:
{
  "name": "chartjs-example",
  "version": "1.0.0",
  "license": "MIT",
  "scripts": {
    "dev": "parcel src/index.html",
    "build": "parcel build src/index.html"
  },
  "devDependencies": {
    "parcel": "^2.6.2"
  },
  "dependencies": {
    "@cubejs-client/core": "^0.31.0",
    "chart.js": "^4.0.0"
  }
}
现代前端应用通常使用 JavaScript 模块打包器,因此我们选择 Parcel (opens new window) 作为一个不错的零配置构建工具。我们还为 立方体 (opens new window) 安装了 Chart.js v4 和一个 JavaScript 客户端,这是一个用于数据应用的开源 API,我们将使用它来获取真实世界的数据(稍后会详细介绍)。
¥Modern front-end applications often use JavaScript module bundlers, so we’ve picked Parcel (opens new window) as a nice zero-configuration build tool. We’re also installing Chart.js v4 and a JavaScript client for Cube (opens new window), an open-source API for data apps we’ll use to fetch real-world data (more on that later).
运行 npm install、yarn install 或 pnpm install 以安装依赖,然后创建 src 文件夹。在该文件夹中,我们需要一个非常简单的 index.html 文件:
¥Run npm install, yarn install, or pnpm install to install the dependencies, then create the src folder. Inside that folder, we’ll need a very simple index.html file:
<!doctype html>
<html lang="en">
  <head>
    <title>Chart.js example</title>
  </head>
  <body>
    <!-- <div style="width: 500px;"><canvas id="dimensions"></canvas></div><br/> -->
    <div style="width: 800px;"><canvas id="acquisitions"></canvas></div>
    <!-- <script type="module" src="dimensions.js"></script> -->
    <script type="module" src="acquisitions.js"></script>
  </body>
</html>
如你所见,Chart.js 需要最少的标记:带有 id 的 canvas 标签,稍后我们将通过它来引用图表。默认情况下,Chart.js 图表是 responsive 并占用整个封闭容器。所以,我们设置 div 的宽度来控制图表的宽度。
¥As you can see, Chart.js requires minimal markup: a canvas tag with an id by which we’ll reference the chart later. By default, Chart.js charts are responsive and take the whole enclosing container. So, we set the width of the div to control chart width.
最后,让我们创建包含以下内容的 src/acquisitions.js 文件:
¥Lastly, let’s create the src/acquisitions.js file with the following contents:
import Chart from 'chart.js/auto'
(async function() {
  const data = [
    { year: 2010, count: 10 },
    { year: 2011, count: 20 },
    { year: 2012, count: 15 },
    { year: 2013, count: 25 },
    { year: 2014, count: 22 },
    { year: 2015, count: 30 },
    { year: 2016, count: 28 },
  ];
  new Chart(
    document.getElementById('acquisitions'),
    {
      type: 'bar',
      data: {
        labels: data.map(row => row.year),
        datasets: [
          {
            label: 'Acquisitions by year',
            data: data.map(row => row.count)
          }
        ]
      }
    }
  );
})();
让我们看一下这段代码:
¥Let’s walk through this code:
我们从特殊的
chart.js/auto路径导入Chart,主要的 Chart.js 类。它加载 所有可用的 Chart.js 组件(非常方便)但不允许 tree-shaking。我们稍后会解决这个问题。¥We import
Chart, the main Chart.js class, from the specialchart.js/autopath. It loads all available Chart.js components (which is very convenient) but disallows tree-shaking. We’ll address that later.我们实例化一个新的
Chart实例并提供两个参数:将渲染图表的画布元素和选项对象。¥We instantiate a new
Chartinstance and provide two arguments: the canvas element where the chart would be rendered and the options object.我们只需要提供一个图表类型 (
bar) 并提供由labels(通常是数据点的数字或文本描述)和一个datasets数组(Chart.js 支持大多数图表类型的多个数据集)组成的data。每个数据集都指定有label并包含一个数据点数组。¥We just need to provide a chart type (
bar) and providedatawhich consists oflabels(often, numeric or textual descriptions of data points) and an array ofdatasets(Chart.js supports multiple datasets for most chart types). Each dataset is designated with alabeland contains an array of data points.目前,我们只有一些虚拟数据条目。因此,我们提取
year和count属性以生成labels的数组和唯一数据集中的数据点。¥For now, we only have a few entries of dummy data. So, we extract
yearandcountproperties to produce the arrays oflabelsand data points within the only dataset.
是时候使用 npm run dev、yarn dev 或 pnpm dev 运行示例并在 Web 浏览器中导航到 localhost:1234 (opens new window):
¥Time to run the example with npm run dev, yarn dev, or pnpm dev and navigate to localhost:1234 (opens new window) in your web browser:
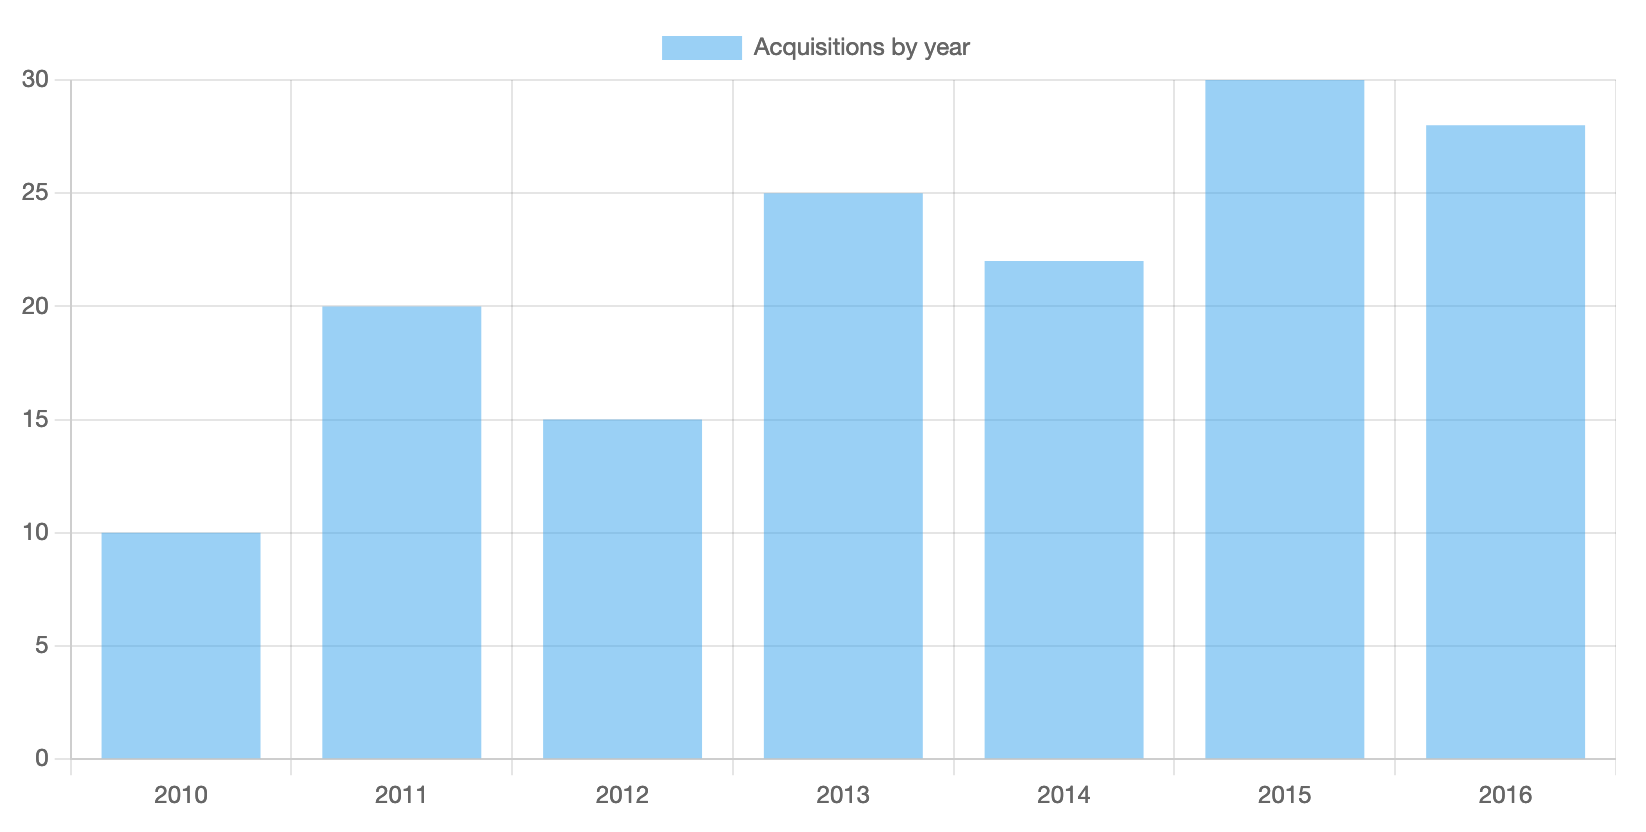
只需几行代码,我们就得到了一个具有很多功能的图表:a 悬停时显示 legend、网格线、刻度 和 tooltips。刷新几次网页,看到图表也是 animated。尝试单击“按年份获取”标签,看看你还可以切换数据集可见性(当你有多个数据集时特别有用)。
¥With just a few lines of code, we’ve got a chart with a lot of features: a legend, grid lines, ticks, and tooltips shown on hover. Refresh the web page a few times to see that the chart is also animated. Try clicking on the “Acquisitions by year” label to see that you’re also able to toggle datasets visibility (especially useful when you have multiple datasets).
# 简单的定制
¥Simple customizations
让我们看看如何自定义 Chart.js 图表。首先,让我们关闭动画以便图表立即出现。其次,让我们隐藏图例和工具提示,因为我们只有一个数据集和非常微不足道的数据。
¥Let’s see how Chart.js charts can be customized. First, let’s turn off the animations so the chart appears instantly. Second, let’s hide the legend and tooltips since we have only one dataset and pretty trivial data.
用以下代码片段替换 src/acquisitions.js 中的 new Chart(...); 调用:
¥Replace the new Chart(...); invocation in src/acquisitions.js with the following snippet:
  new Chart(
    document.getElementById('acquisitions'),
    {
      type: 'bar',
      options: {
        animation: false,
        plugins: {
          legend: {
            display: false
          },
          tooltip: {
            enabled: false
          }
        }
      },
      data: {
        labels: data.map(row => row.year),
        datasets: [
          {
            label: 'Acquisitions by year',
            data: data.map(row => row.count)
          }
        ]
      }
    }
  );
正如你所看到的,我们已将 options 属性添加到第二个参数中,这样你就可以为 Chart.js 指定各种自定义选项。动画被禁用 带有通过 animation 提供的布尔标志。大多数图表范围的选项(例如,responsiveness 或 设备像素比)都是这样配置的。
¥As you can see, we’ve added the options property to the second argument—that’s how you can specify all kinds of customization options for Chart.js. The animation is disabled with a boolean flag provided via animation. Most chart-wide options (e.g., responsiveness or device pixel ratio) are configured like this.
图例和工具提示隐藏在 plugins 中相应部分下提供的布尔标志中。请注意,一些 Chart.js 功能被提取到插件中:独立的、独立的代码片段。其中一些作为 Chart.js 分布 (opens new window) 的一部分提供,其他插件是独立维护的,可以位于插件、框架集成和其他图表类型的 很棒的清单 (opens new window) 中。
¥The legend and tooltips are hidden with boolean flags provided under the respective sections in plugins. Note that some of Chart.js features are extracted into plugins: self-contained, separate pieces of code. A few of them are available as a part of Chart.js distribution (opens new window), other plugins are maintained independently and can be located in the awesome list (opens new window) of plugins, framework integrations, and additional chart types.
你应该能够在浏览器中看到更新后的简约图表。
¥You should be able to see the updated minimalistic chart in your browser.
# 真实世界的数据
¥Real-world data
使用硬编码、大小有限、不切实际的数据,很难展示 Chart.js 的全部潜力。让我们快速连接到数据 API,使我们的示例应用更接近生产用例。
¥With hardcoded, limited-size, unrealistic data, it’s hard to show the full potential of Chart.js. Let’s quickly connect to a data API to make our example application closer to a production use case.
让我们创建包含以下内容的 src/api.js 文件:
¥Let’s create the src/api.js file with the following contents:
import { CubejsApi } from '@cubejs-client/core';
const apiUrl = 'https://heavy-lansford.gcp-us-central1.cubecloudapp.dev/cubejs-api/v1';
const cubeToken = 'eyJhbGciOiJIUzI1NiIsInR5cCI6IkpXVCJ9.eyJpYXQiOjEwMDAwMDAwMDAsImV4cCI6NTAwMDAwMDAwMH0.OHZOpOBVKr-sCwn8sbZ5UFsqI3uCs6e4omT7P6WVMFw';
const cubeApi = new CubejsApi(cubeToken, { apiUrl });
export async function getAquisitionsByYear() {
  const acquisitionsByYearQuery = {
    dimensions: [
      'Artworks.yearAcquired',
    ],
    measures: [
      'Artworks.count'
    ],
    filters: [ {
      member: 'Artworks.yearAcquired',
      operator: 'set'
    } ],
    order: {
      'Artworks.yearAcquired': 'asc'
    }
  };
  const resultSet = await cubeApi.load(acquisitionsByYearQuery);
  return resultSet.tablePivot().map(row => ({
    year: parseInt(row['Artworks.yearAcquired']),
    count: parseInt(row['Artworks.count'])
  }));
}
export async function getDimensions() {
  const dimensionsQuery = {
    dimensions: [
      'Artworks.widthCm',
      'Artworks.heightCm'
    ],
    measures: [
      'Artworks.count'
    ],
    filters: [
      {
        member: 'Artworks.classification',
        operator: 'equals',
        values: [ 'Painting' ]
      },
      {
        member: 'Artworks.widthCm',
        operator: 'set'
      },
      {
        member: 'Artworks.widthCm',
        operator: 'lt',
        values: [ '500' ]
      },
      {
        member: 'Artworks.heightCm',
        operator: 'set'
      },
      {
        member: 'Artworks.heightCm',
        operator: 'lt',
        values: [ '500' ]
      }
    ]
  };
  const resultSet = await cubeApi.load(dimensionsQuery);
  return resultSet.tablePivot().map(row => ({
    width: parseInt(row['Artworks.widthCm']),
    height: parseInt(row['Artworks.heightCm']),
    count: parseInt(row['Artworks.count'])
  }));
}
让我们看看那里发生了什么:
¥Let’s see what’s happening there:
我们
import立方体 (opens new window) 的 JavaScript 客户端库,一个用于数据应用的开源 API,使用 API URL (apiUrl) 和身份验证令牌 (cubeToken) 配置它,最后实例化客户端 (cubeApi)。¥We
importthe JavaScript client library for Cube (opens new window), an open-source API for data apps, configure it with the API URL (apiUrl) and the authentication token (cubeToken), and finally instantiate the client (cubeApi).Cube API 托管在 立方云 (opens new window) 中,并连接到一个数据库,其中包含约 140,000 条记录的 公共数据集 (opens new window),代表美国纽约 现代艺术博物馆 (opens new window) 集合的所有艺术品。当然,这是一个比我们现在拥有的更真实的数据集。
¥Cube API is hosted in Cube Cloud (opens new window) and connected to a database with a public dataset (opens new window) of ~140,000 records representing all of the artworks in the collection of the Museum of Modern Art (opens new window) in New York, USA. Certainly, a more real-world dataset than what we’ve got now.
我们定义了几个异步函数来从 API 中获取数据:
getAquisitionsByYear和getDimensions。第一个返回按收购年份划分的艺术品数量,另一个返回每个宽高对的艺术品数量(我们将需要它用于另一个图表)。¥We define a couple of asynchronous functions to fetch data from the API:
getAquisitionsByYearandgetDimensions. The first one returns the number of artworks by the year of acquisition, the other returns the number of artworks for every width-height pair (we’ll need it for another chart).让我们来看看
getAquisitionsByYear。首先,我们在acquisitionsByYearQuery变量中创建一个声明性的、基于 JSON 的查询。如你所见,我们指定对于每个yearAcquired,我们希望获得艺术品的count;yearAcquired必须被设置(即不是未定义的);结果集将按yearAcquired升序排序。¥Let’s take a look at
getAquisitionsByYear. First, we create a declarative, JSON-based query in theacquisitionsByYearQueryvariable. As you can see, we specify that for everyyearAcquiredwe’d like to get thecountof artworks;yearAcquiredhas to be set (i.e., not undefined); the result set would be sorted byyearAcquiredin the ascending order.其次,我们通过调用
cubeApi.load获取resultSet,并将其映射到具有所需year和count属性的对象数组。¥Second, we fetch the
resultSetby callingcubeApi.loadand map it to an array of objects with desiredyearandcountproperties.
现在,让我们将真实世界的数据传送到我们的图表。请对 src/acquisitions.js 应用一些更改:添加导入并替换 data 变量的定义。
¥Now, let’s deliver the real-world data to our chart. Please apply a couple of changes to src/acquisitions.js: add an import and replace the definition of the data variable.
import { getAquisitionsByYear } from './api'
// ...
const data = await getAquisitionsByYear();
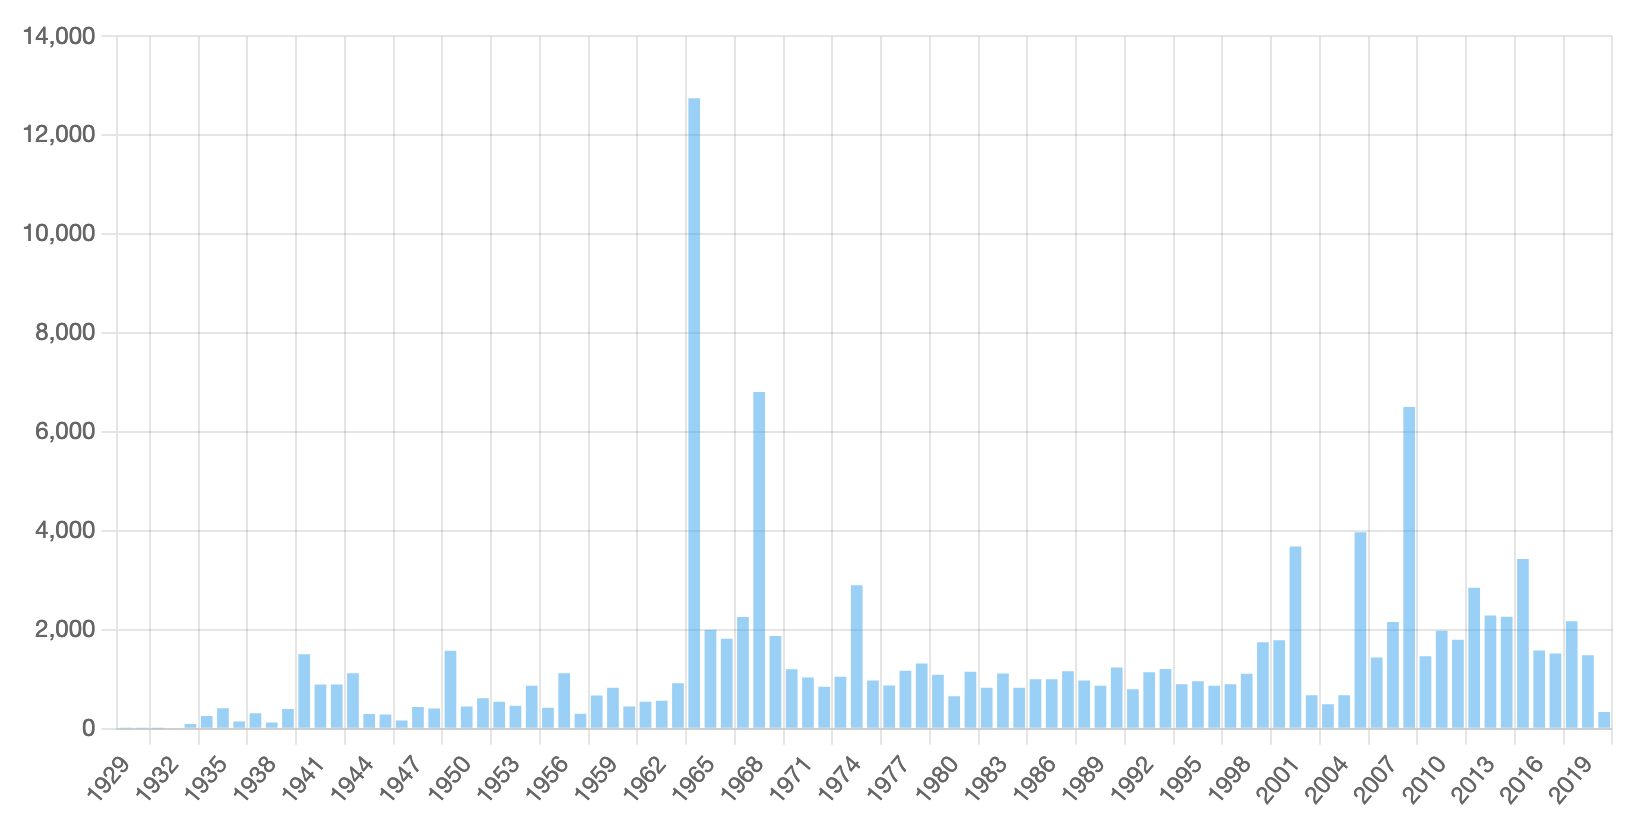
完毕!现在,我们的真实世界数据图表如下所示。看来 1964 年、1968 年、2008 年都发生了一些有趣的事情!
¥Done! Now, our chart with real-world data looks like this. Looks like something interesting happened in 1964, 1968, and 2008!
我们完成了柱状图。让我们尝试另一种 Chart.js 图表类型。
¥We’re done with the bar chart. Let’s try another Chart.js chart type.
# 进一步定制
¥Further customizations
Chart.js 支持许多常见的图表类型。
¥Chart.js supports many common chart types.
例如,气泡图 允许同时展示三个维度的数据:x 和 y 轴上的位置表示两个维度,第三个维度由单个气泡的大小表示。
¥For instance, Bubble chart allows to display three dimensions of data at the same time: locations on x and y axes represent two dimensions, and the third dimension is represented by the size of the individual bubbles.
要创建图表,请停止已在运行的应用,然后转至 src/index.html,并取消注释以下两行:
¥To create the chart, stop the already running application, then go to src/index.html, and uncomment the following two lines:
<div style="width: 500px;"><canvas id="dimensions"></canvas></div><br/>
<script type="module" src="dimensions.js"></script>
然后,创建包含以下内容的 src/dimensions.js 文件:
¥Then, create the src/dimensions.js file with the following contents:
import Chart from 'chart.js/auto'
import { getDimensions } from './api'
(async function() {
  const data = await getDimensions();
  new Chart(
    document.getElementById('dimensions'),
    {
      type: 'bubble',
      data: {
        labels: data.map(x => x.year),
        datasets: [
          {
            label: 'Dimensions',
            data: data.map(row => ({
              x: row.width,
              y: row.height,
              r: row.count
            }))
          }
        ]
      }
    }
  );
})();
可能那里的一切都非常简单:我们从 API 获取数据并渲染 bubble 类型的新图表,将数据的三个维度作为 x、y 和 r(半径)属性传递。
¥Probably, everything is pretty straightforward there: we get data from the API and render a new chart with the bubble type, passing three dimensions of data as x, y, and r (radius) properties.
现在,使用 rm -rf .parcel-cache 重置缓存并使用 npm run dev、yarn dev 或 pnpm dev 再次启动应用。我们现在可以查看新图表:
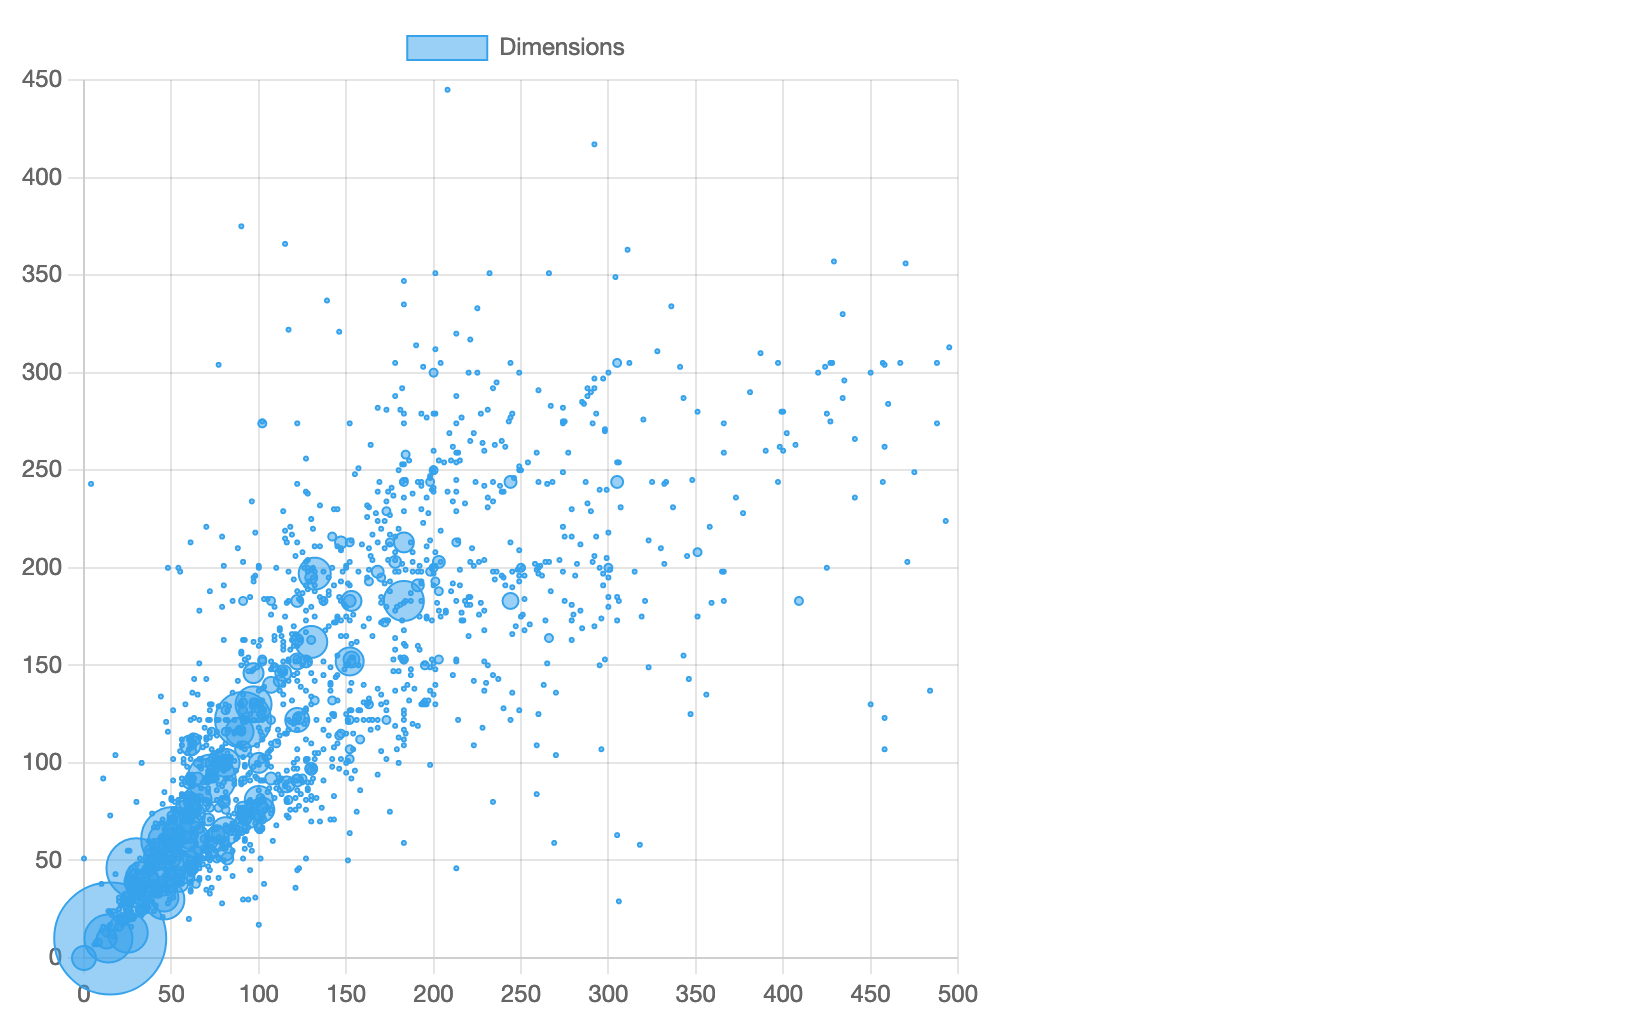
¥Now, reset caches with rm -rf .parcel-cache and start the application again with npm run dev, yarn dev, or pnpm dev. We can review the new chart now:
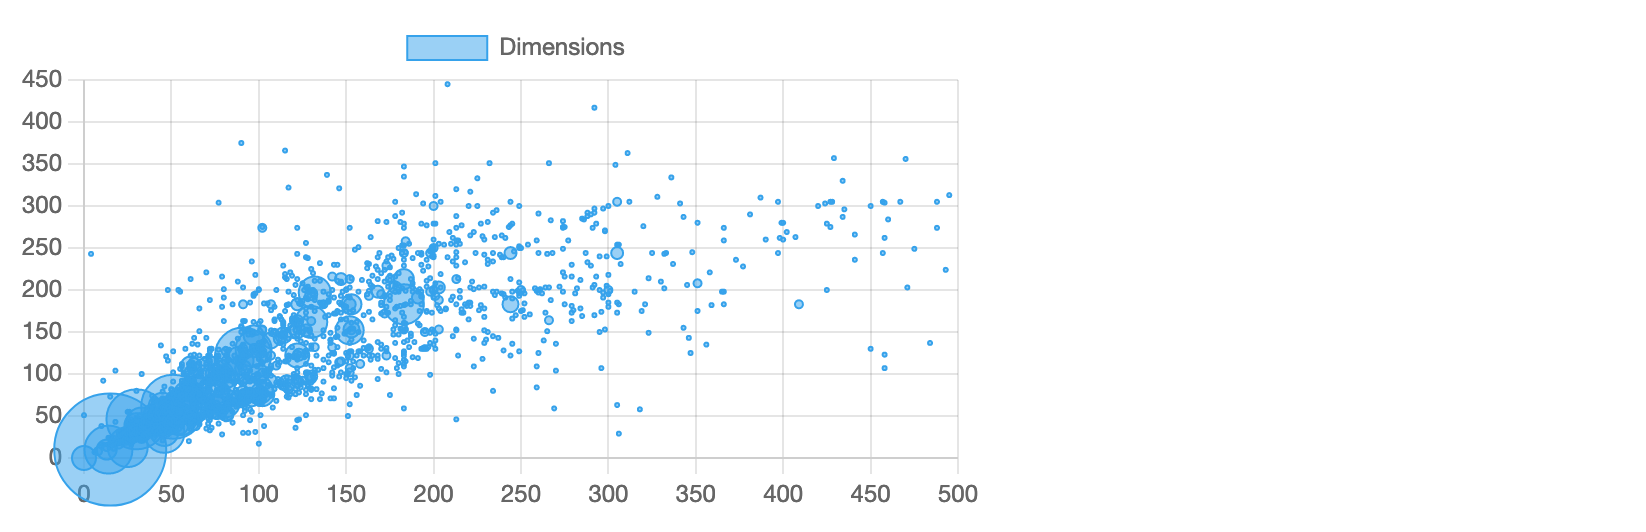
好吧,它看起来并不漂亮。
¥Well, it doesn’t look pretty.
首先,图表不是正方形的。图稿的宽度和高度同样重要,因此我们希望图表的宽度也等于它的高度。默认情况下,Chart.js 图表的 纵横比 为 1(对于所有径向图表,例如圆环图)或 2(对于所有其他图表)。让我们修改图表的纵横比:
¥First of all, the chart is not square. Artworks’ width and height are equally important so we’d like to make the chart width equal to its height as well. By default, Chart.js charts have the aspect ratio of either 1 (for all radial charts, e.g., a doughnut chart) or 2 (for all the rest). Let’s modify the aspect ratio for our chart:
// ...
	new Chart(
    document.getElementById('dimensions'),
    {
      type: 'bubble',
      options: {
        aspectRatio: 1,
      },
// ...
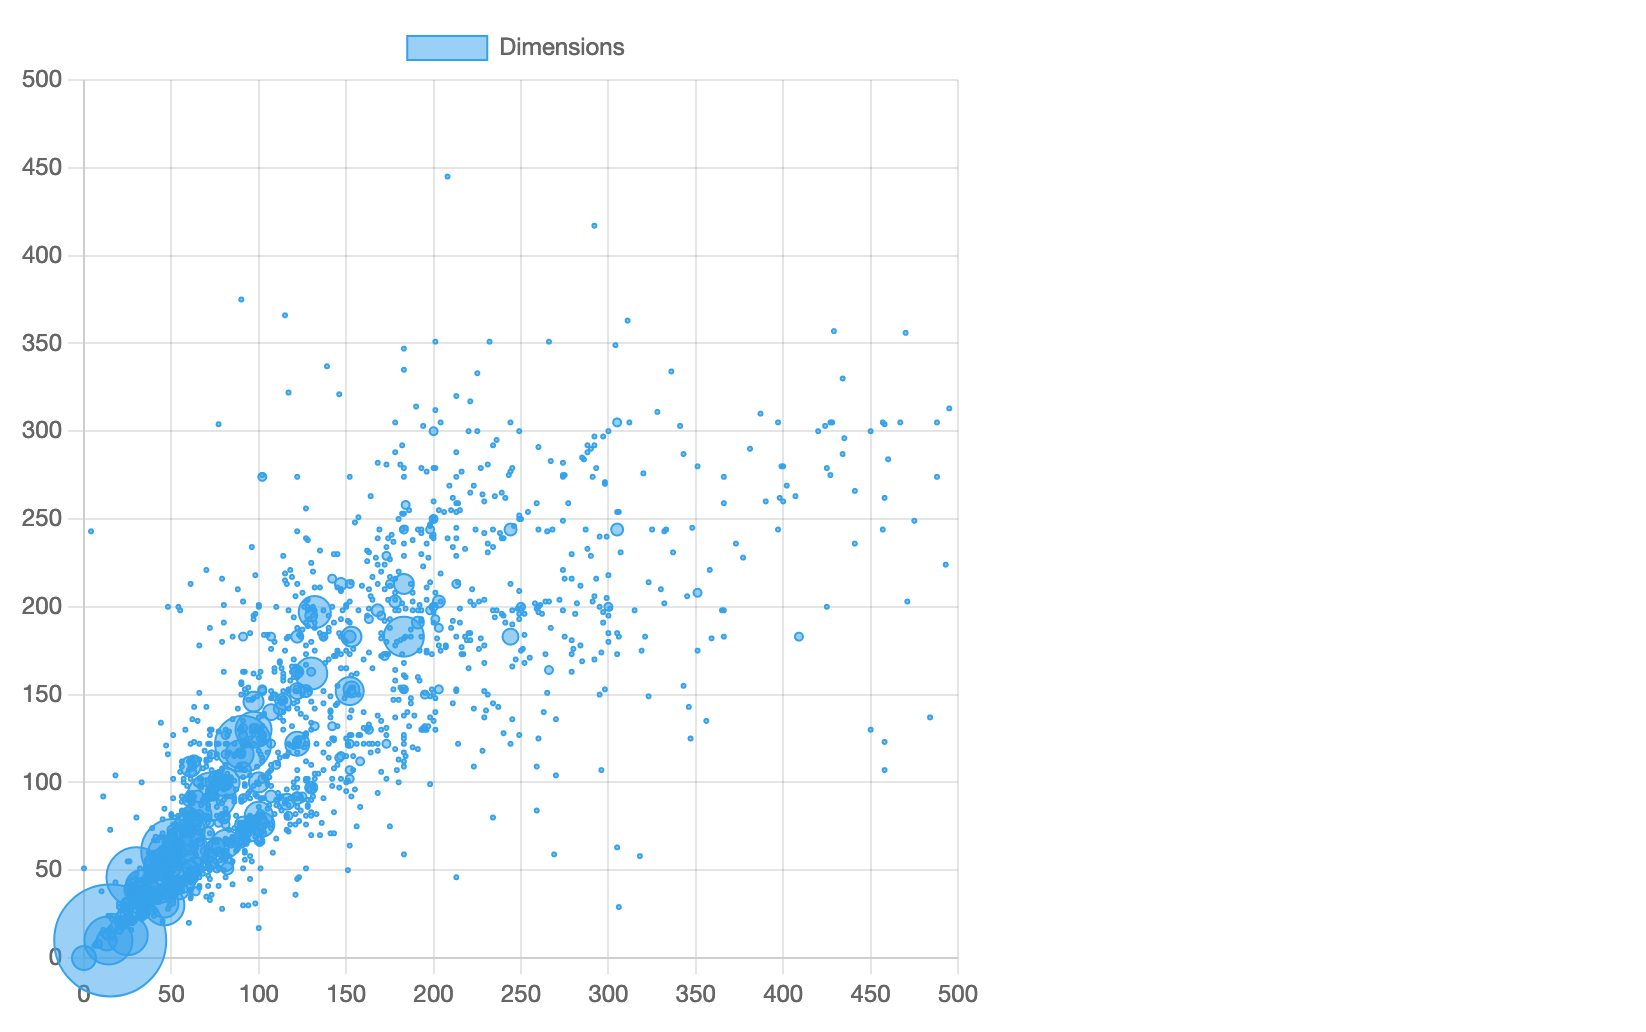
现在看起来好多了:
¥Looks much better now:
然而,它仍然不理想。水平轴的范围从 0 到 500,而垂直轴的范围从 0 到 450。默认情况下,Chart.js 会自动将轴的范围(最小值和最大值)调整为数据集中提供的值,以便图表“适合”你的数据。显然,MoMa 集合中没有 450 至 500 厘米高度范围内的艺术品。让我们修改图表的 轴配置 以说明这一点:
¥However, it’s still not ideal. The horizontal axis spans from 0 to 500 while the vertical axis spans from 0 to 450. By default, Chart.js automatically adjusts the range (minimum and maximum values) of the axes to the values provided in the dataset, so the chart “fits” your data. Apparently, MoMa collection doesn’t have artworks in the range of 450 to 500 cm in height. Let’s modify the axes configuration for our chart to account for that:
// ...
  new Chart(
    document.getElementById('dimensions'),
    {
      type: 'bubble',
      options: {
        aspectRatio: 1,
        scales: {
          x: {
            max: 500
          },
          y: {
            max: 500
          }
        }
      },
// ...
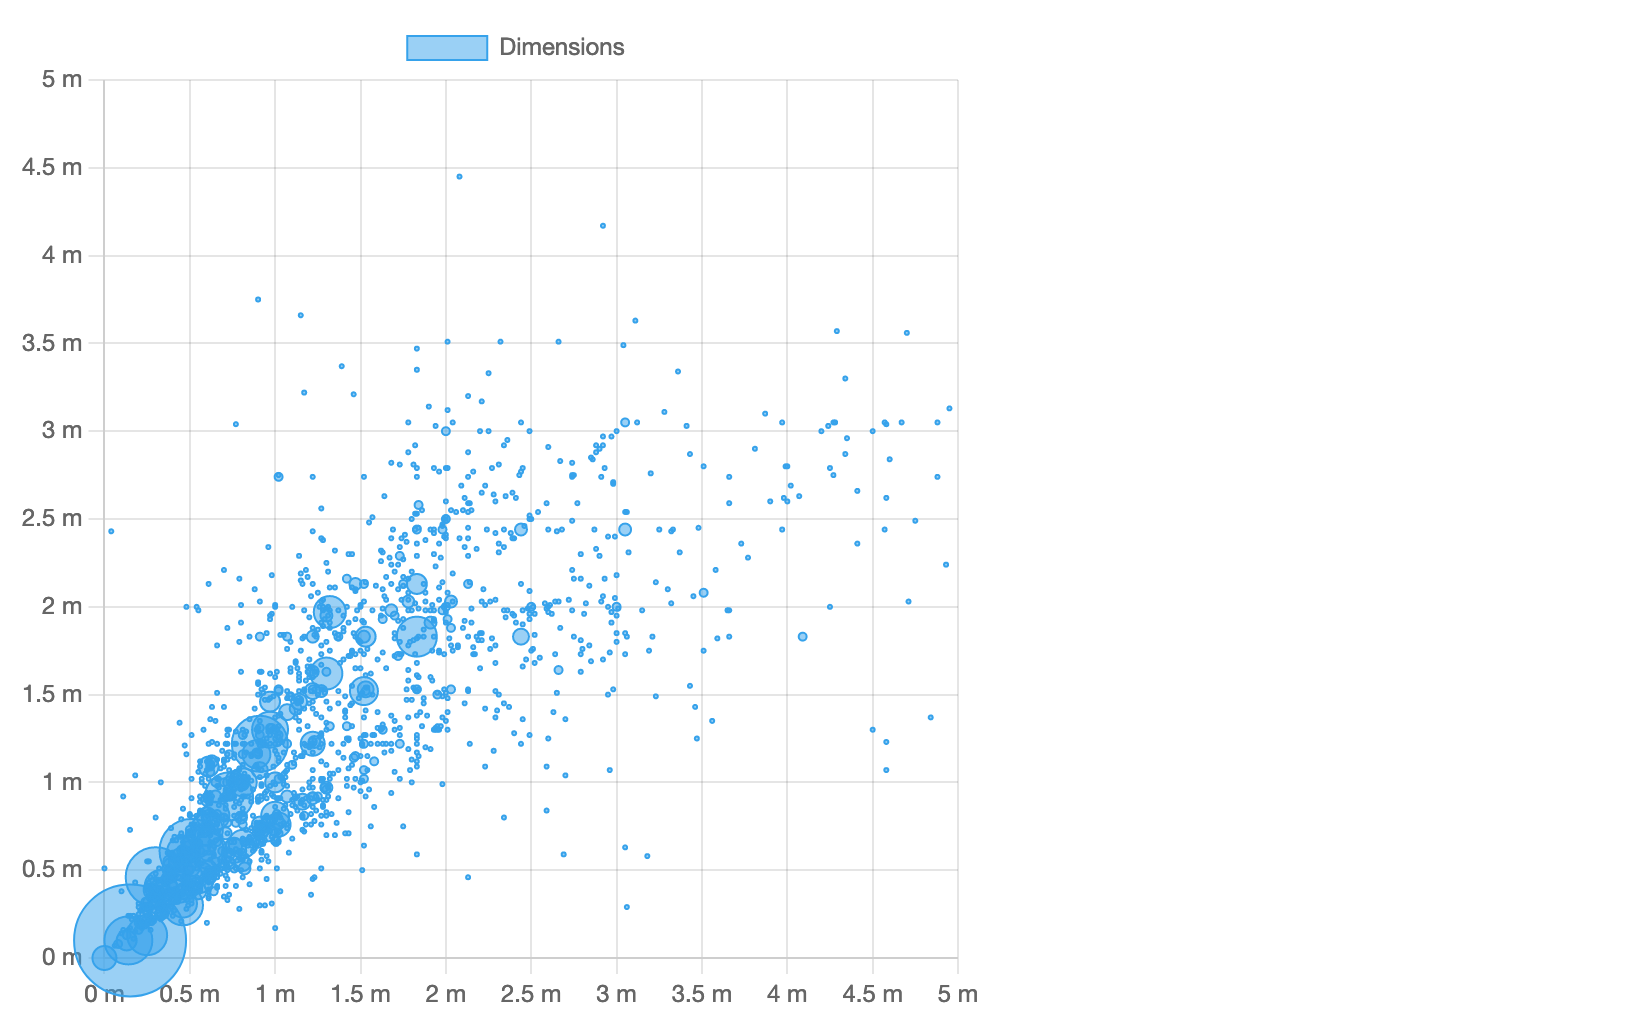
很好!看看更新后的图表:
¥Great! Behold the updated chart:
然而,还有一个挑剔的地方:这些数字是多少?单位是厘米不是很明显。让我们将 自定义刻度格式 应用于两个轴以使事情变得清楚。我们将提供一个回调函数,调用它来格式化每个刻度值。这是更新的轴配置:
¥However, there’s one more nitpick: what are these numbers? It’s not very obvious that the units are centimetres. Let’s apply a custom tick format to both axes to make things clear. We’ll provide a callback function that would be called to format each tick value. Here’s the updated axes configuration:
// ...
  new Chart(
    document.getElementById('dimensions'),
    {
      type: 'bubble',
      options: {
        aspectRatio: 1,
        scales: {
          x: {
            max: 500,
            ticks: {
              callback: value => `${value / 100} m`
            }
          },
          y: {
            max: 500,
            ticks: {
              callback: value => `${value / 100} m`
            }
          }
        }
      },
// ...
完美,现在我们在两个轴上都有正确的单位:
¥Perfect, now we have proper units on both axes:
# 多个数据集
¥Multiple datasets
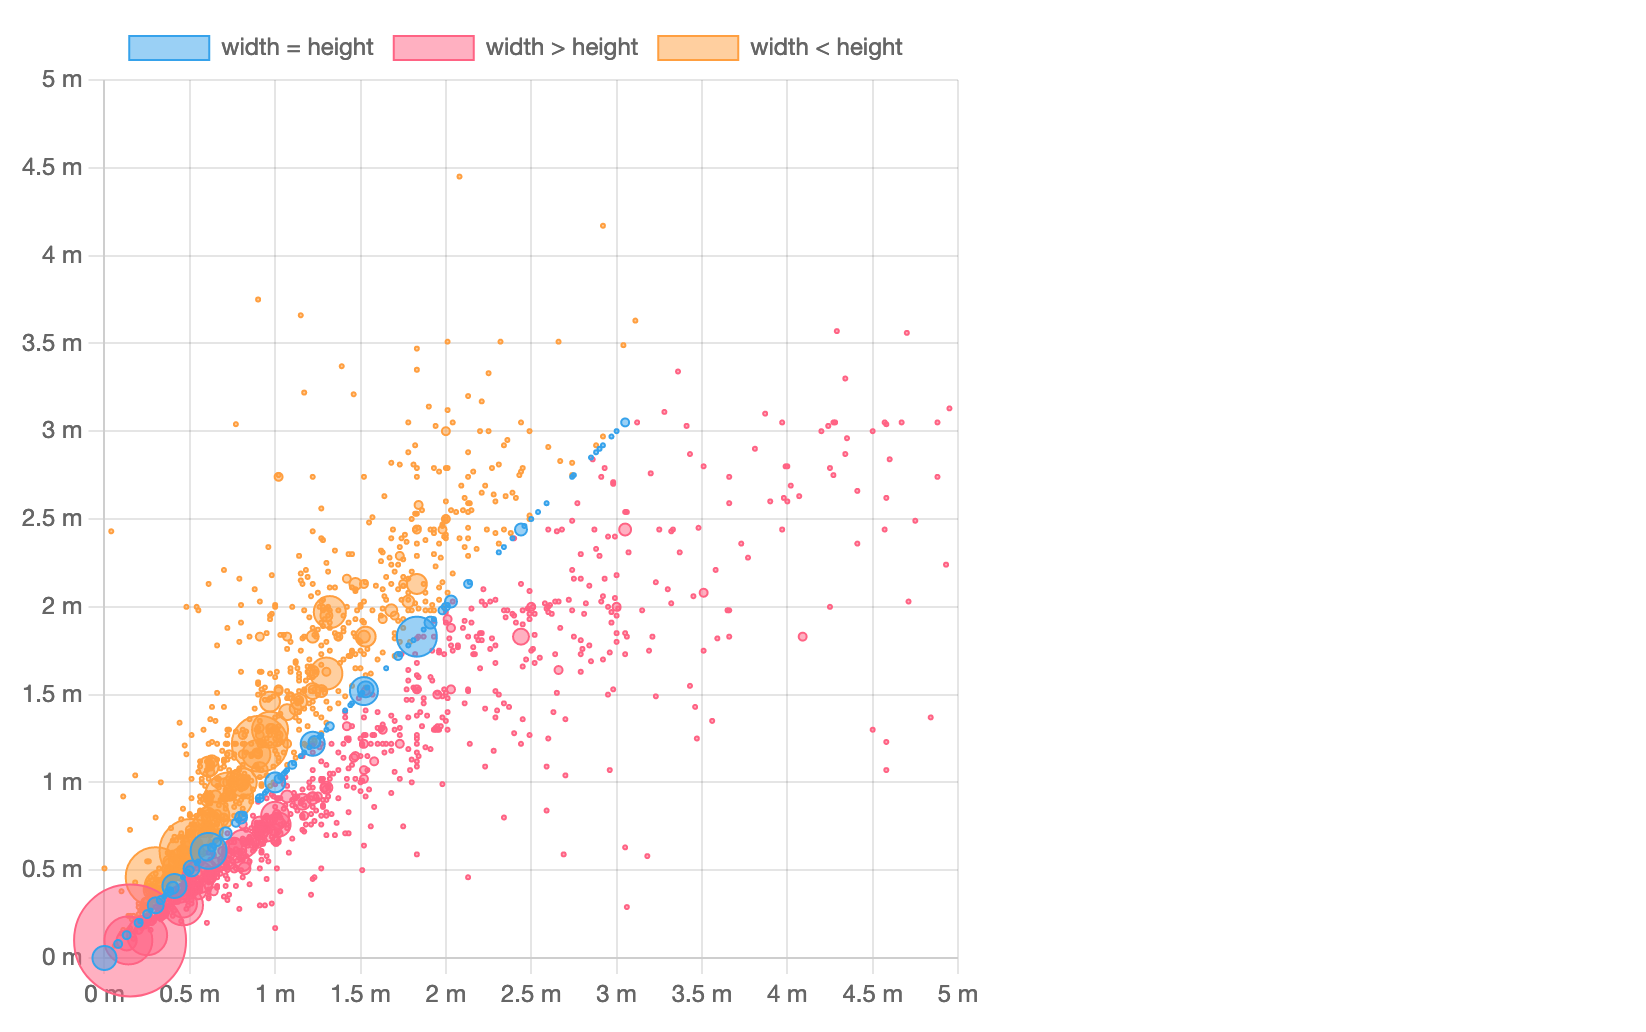
Chart.js 独立绘制每个数据集并允许对它们应用自定义样式。
¥Chart.js plots each dataset independently and allows to apply custom styles to them.
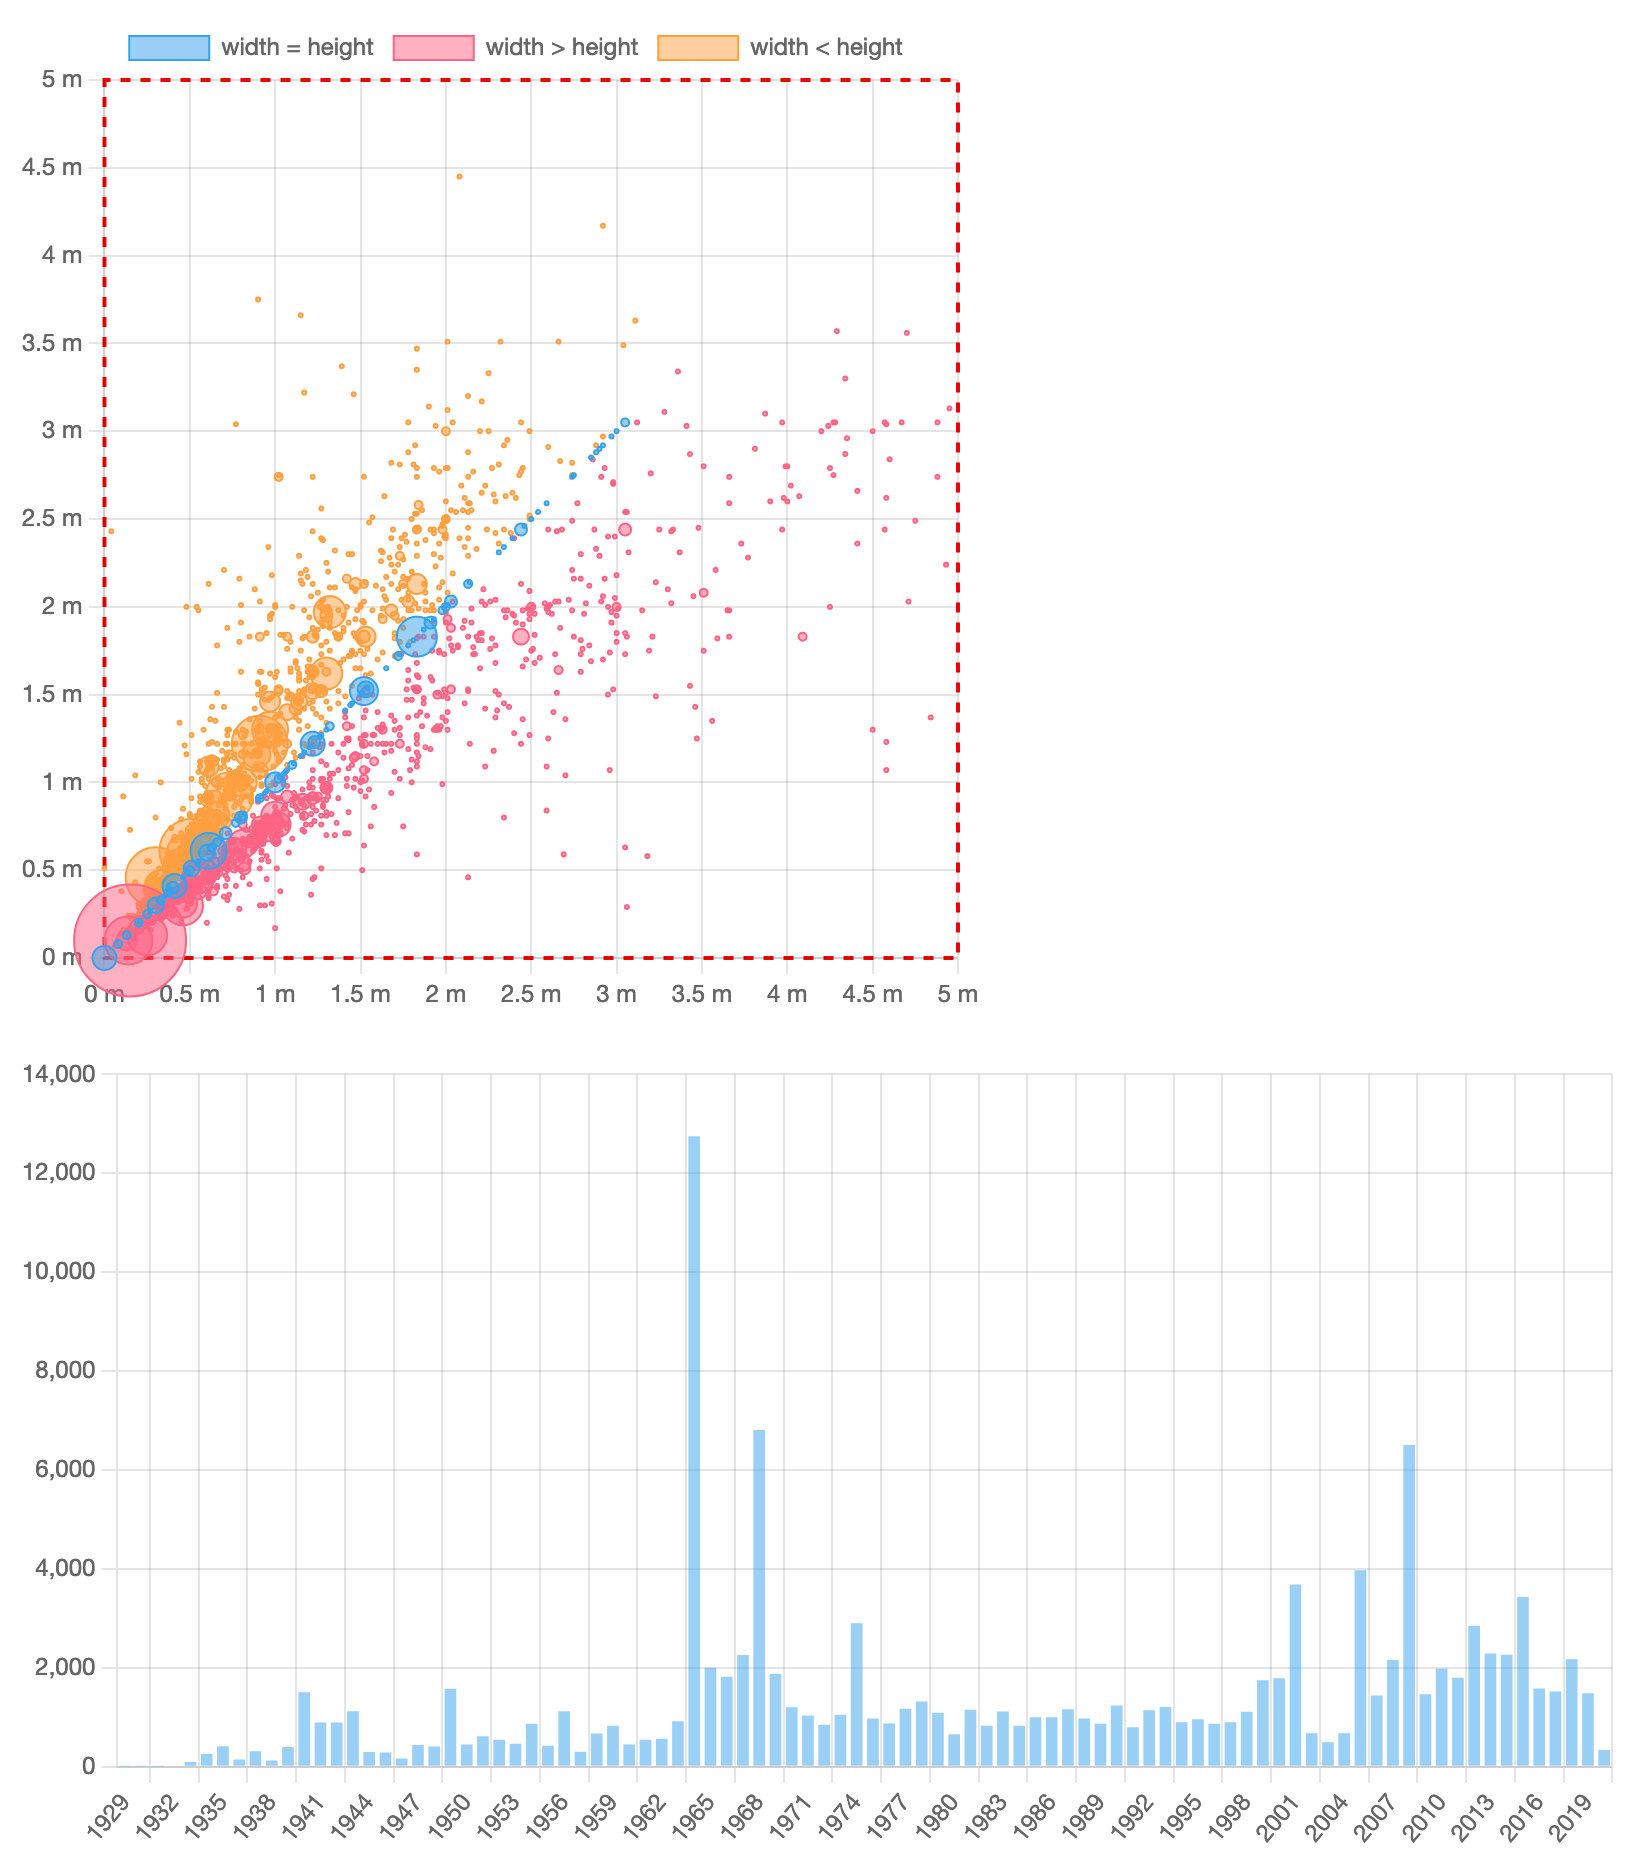
看一下图表:有一条可见的气泡“线”,其 x 和 y 坐标相等,代表方形艺术品。将这些气泡放入它们自己的数据集中并以不同方式绘制它们会很酷。此外,我们可以将“较高”的艺术品与“较宽”的艺术品分开,并以不同的方式绘制它们。
¥Take a look at the chart: there’s a visible “line” of bubbles with equal x and y coordinates representing square artworks. It would be cool to put these bubbles in their own dataset and paint them differently. Also, we can separate “taller” artworks from “wider” ones and paint them differently, too.
以下是我们如何做到这一点。将 datasets 替换为以下代码:
¥Here’s how we can do that. Replace the datasets with the following code:
// ...
        datasets: [
          {
            label: 'width = height',
            data: data
              .filter(row => row.width === row.height)
              .map(row => ({
                x: row.width,
                y: row.height,
                r: row.count
              }))
          },
          {
            label: 'width > height',
            data: data
              .filter(row => row.width > row.height)
              .map(row => ({
                x: row.width,
                y: row.height,
                r: row.count
              }))
          },
          {
            label: 'width < height',
            data: data
              .filter(row => row.width < row.height)
              .map(row => ({
                x: row.width,
                y: row.height,
                r: row.count
              }))
          }
        ]
// ..
如你所见,我们定义了三个具有不同标签的数据集。每个数据集都有自己的用 filter 提取的数据切片。现在它们在视觉上是截然不同的,而且正如你所知,你可以独立切换它们的可见性。
¥As you can see, we define three datasets with different labels. Each dataset gets its own slice of data extracted with filter. Now they are visually distinct and, as you already know, you can toggle their visibility independently.
这里我们依赖于默认的调色板。但是,请记住,每种图表类型都支持大量你可以随意自定义的 数据集选项。
¥Here we rely on the default color palette. However, keep in mind every chart type supports a lot of dataset options that you can feel free to customize.
# 插件
¥Plugins
另一种非常强大的自定义 Chart.js 图表的方法是使用插件。你可以在 插件目录 (opens new window) 中找到一些或创建你自己的临时文件。在 Chart.js 生态系统中,它是惯用的,并且有望使用插件微调图表。例如,你可以使用简单的临时插件为其自定义 canvas 背景 或 添加边框。让我们试试后者。
¥Another—and very powerful!—way to customize Chart.js charts is to use plugins. You can find some in the plugin directory (opens new window) or create your own, ad-hoc ones. In Chart.js ecosystem, it’s idiomatic and expected to fine tune charts with plugins. For example, you can customize canvas background or add a border to it with simple ad-hoc plugins. Let’s try the latter.
插件具有 广泛的 API,但简而言之,插件被定义为具有 name 的对象以及在扩展点中定义的一个或多个回调函数。在 src/dimensions.js 中的 new Chart(...); 调用之前和位置插入以下代码段:
¥Plugins have an extensive API but, in a nutshell, a plugin is defined as an object with a name and one or more callback functions defined in the extension points. Insert the following snippet before and in place of the new Chart(...); invocation in src/dimensions.js:
// ...
  const chartAreaBorder = {
    id: 'chartAreaBorder',
    beforeDraw(chart, args, options) {
      const { ctx, chartArea: { left, top, width, height } } = chart;
      ctx.save();
      ctx.strokeStyle = options.borderColor;
      ctx.lineWidth = options.borderWidth;
      ctx.setLineDash(options.borderDash || []);
      ctx.lineDashOffset = options.borderDashOffset;
      ctx.strokeRect(left, top, width, height);
      ctx.restore();
    }
  };
  new Chart(
    document.getElementById('dimensions'),
    {
      type: 'bubble',
      plugins: [ chartAreaBorder ],
      options: {
        plugins: {
          chartAreaBorder: {
            borderColor: 'red',
            borderWidth: 2,
            borderDash: [ 5, 5 ],
            borderDashOffset: 2,
          }
        },
        aspectRatio: 1,
// ...
如你所见,在这个 chartAreaBorder 插件中,我们获取画布上下文,保存其当前状态,应用样式,在图表区域周围绘制一个矩形,并恢复画布状态。我们还在 plugins 中传递了该插件,因此它仅适用于此特定图表。我们还在 options.plugins.chartAreaBorder 中传递了插件选项;我们当然可以在插件源代码中对它们进行硬编码,但这种方式的可重用性要高得多。
¥As you can see, in this chartAreaBorder plugin, we acquire the canvas context, save its current state, apply styles, draw a rectangular shape around the chart area, and restore the canvas state. We’re also passing the plugin in plugins so it’s only applied to this particular chart. We also pass the plugin options in options.plugins.chartAreaBorder; we could surely hardcode them in the plugin source code but it’s much more reusable this way.
我们的气泡图现在看起来更好看了:
¥Our bubble chart looks fancier now:
# 摇树
¥Tree-shaking
在生产中,我们力求发布尽可能少的代码,以便终端用户可以更快地加载我们的数据应用并获得更好的体验。为此,我们需要应用 tree-shaking (opens new window),这是一个用于从 JavaScript 包中删除未使用代码的奇特术语。
¥In production, we strive to ship as little code as possible, so the end users can load our data applications faster and have better experience. For that, we’ll need to apply tree-shaking (opens new window) which is fancy term for removing unused code from the JavaScript bundle.
Chart.js 完全支持 tree-shaking 及其组件设计。你可以一次注册所有 Chart.js 组件(这在你制作原型时很方便)并将它们与你的应用打包在一起。或者,你可以只注册必要的组件并获得最小的包,大小要小得多。
¥Chart.js fully supports tree-shaking with its component design. You can register all Chart.js components at once (which is convenient when you’re prototyping) and get them bundled with your application. Or, you can register only necessary components and get a minimal bundle, much less in size.
让我们检查一下我们的示例应用。打包包大小是多少?你可以停止应用并运行 npm run build、yarn build 或 pnpm build。片刻之后,你将得到如下内容:
¥Let’s inspect our example application. What’s the bundle size? You can stop the application and run npm run build, or yarn build, or pnpm build. In a few moments, you’ll get something like this:
% yarn build
yarn run v1.22.17
$ parcel build src/index.html
✨ Built in 88ms
dist/index.html              381 B   164ms
dist/index.74a47636.js   265.48 KB   1.25s
dist/index.ba0c2e17.js       881 B    63ms
✨ Done in 0.51s.
我们可以看到 Chart.js 和其他依赖被打包在一个 265 KB 的文件中。
¥We can see that Chart.js and other dependencies were bundled together in a single 265 KB file.
为了减小包的大小,我们需要对 src/acquisitions.js 和 src/dimensions.js 进行一些更改。首先,我们需要从两个文件中删除以下导入语句:import Chart from 'chart.js/auto'。
¥To reduce the bundle size, we’ll need to apply a couple of changes to src/acquisitions.js and src/dimensions.js. First, we’ll need to remove the following import statement from both files: import Chart from 'chart.js/auto'.
相反,我们只加载必要的组件并使用 Chart.register(...) 将它们“注册”到 Chart.js。这是我们在 src/acquisitions.js 中需要的:
¥Instead, let’s load only necessary components and “register” them with Chart.js using Chart.register(...). Here’s what we need in src/acquisitions.js:
import {
  Chart,
  Colors,
  BarController,
  CategoryScale,
  LinearScale,
  BarElement,
  Legend
} from 'chart.js'
Chart.register(
  Colors,
  BarController,
  BarElement,
  CategoryScale,
  LinearScale,
  Legend
);
这是 src/dimensions.js 的片段:
¥And here’s the snippet for src/dimensions.js:
import {
  Chart,
  Colors,
  BubbleController,
  CategoryScale,
  LinearScale,
  PointElement,
  Legend
} from 'chart.js'
Chart.register(
  Colors,
  BubbleController,
  PointElement,
  CategoryScale,
  LinearScale,
  Legend
);
你可以看到,除了 Chart 类之外,我们还为图表类型、刻度和其他图表元素(例如,条形或点)加载了一个控制器。你可以在 documentation 中查找所有可用组件。
¥You can see that, in addition to the Chart class, we’re also loading a controller for the chart type, scales, and other chart elements (e.g., bars or points). You can look all available components up in the documentation.
或者,你可以在控制台中遵循 Chart.js 的建议。例如,如果你忘记为柱状图导入 BarController,你将在浏览器控制台中看到以下消息:
¥Alternatively, you can follow Chart.js advice in the console. For example, if you forget to import BarController for your bar chart, you’ll see the following message in the browser console:
Unhandled Promise Rejection: Error: "bar" is not a registered controller.
在准备生产应用时,请记住仔细检查是否从 chart.js/auto 导入。像这样只需要一次导入就可以有效地禁用 tree-shaking。
¥Remember to carefully check for imports from chart.js/auto when preparing your application for production. It takes only one import like this to effectively disable tree-shaking.
现在,让我们再次检查我们的应用。运行 yarn build,你会得到这样的东西:
¥Now, let’s inspect our application once again. Run yarn build and you’ll get something like this:
% yarn build
yarn run v1.22.17
$ parcel build src/index.html
✨ Built in 88ms
dist/index.html              381 B   176ms
dist/index.5888047.js    208.66 KB   1.23s
dist/index.dcb2e865.js       932 B    58ms
✨ Done in 0.51s.
通过仅导入和注册选定组件,我们删除了超过 56 KB 的不必要代码。鉴于其他依赖在打包包中占用约 50 KB,tree-shaking 有助于从我们的示例应用的打包包中删除约 25% 的 Chart.js 代码。
¥By importing and registering only select components, we’ve removed more than 56 KB of unnecessary code. Given that other dependencies take ~50 KB in the bundle, tree-shaking helps remove ~25% of Chart.js code from the bundle for our example application.
# 下一步
¥Next steps
现在你已经熟悉了 Chart.js 的所有主要概念:图表类型和元素、数据集、自定义、插件、组件和 tree-shaking。
¥Now you’re familiar with all major concepts of Chart.js: chart types and elements, datasets, customization, plugins, components, and tree-shaking.
请随意查看文档中的许多 图表示例,并检查 Chart.js 插件的 很棒的清单 (opens new window) 和其他图表类型以及 框架整合 (opens new window)(例如,React、Vue、Svelte 等)。另外,不要犹豫加入 Chart.js Discord (opens new window) 并关注 Twitter 上的 Chart.js (opens new window)。
¥Feel free to review many examples of charts in the documentation and check the awesome list (opens new window) of Chart.js plugins and additional chart types as well as framework integrations (opens new window) (e.g., React, Vue, Svelte, etc.). Also, don’t hesitate to join Chart.js Discord (opens new window) and follow Chart.js on Twitter (opens new window).
祝你在使用 Chart.js 的过程中玩得开心,祝你好运!
¥Have fun and good luck building with Chart.js!