# 立即开始
¥Getting Started
让我们开始使用 Chart.js!
¥Let's get started with Chart.js!
按照分步指南操作 以加快使用 Chart.js 的速度
¥**Follow a step-by-step guide to get up to speed with Chart.js**
来自 npm 或 CDN 的 安装 Chart.js
¥Install Chart.js from npm or a CDN
整合 Chart.js 带有打包器、加载器和前端框架
¥Integrate Chart.js with bundlers, loaders, and front-end frameworks
或者,请参阅下面的示例或选中 samples。
¥Alternatively, see the example below or check samples.
# 创建图表
¥Create a Chart
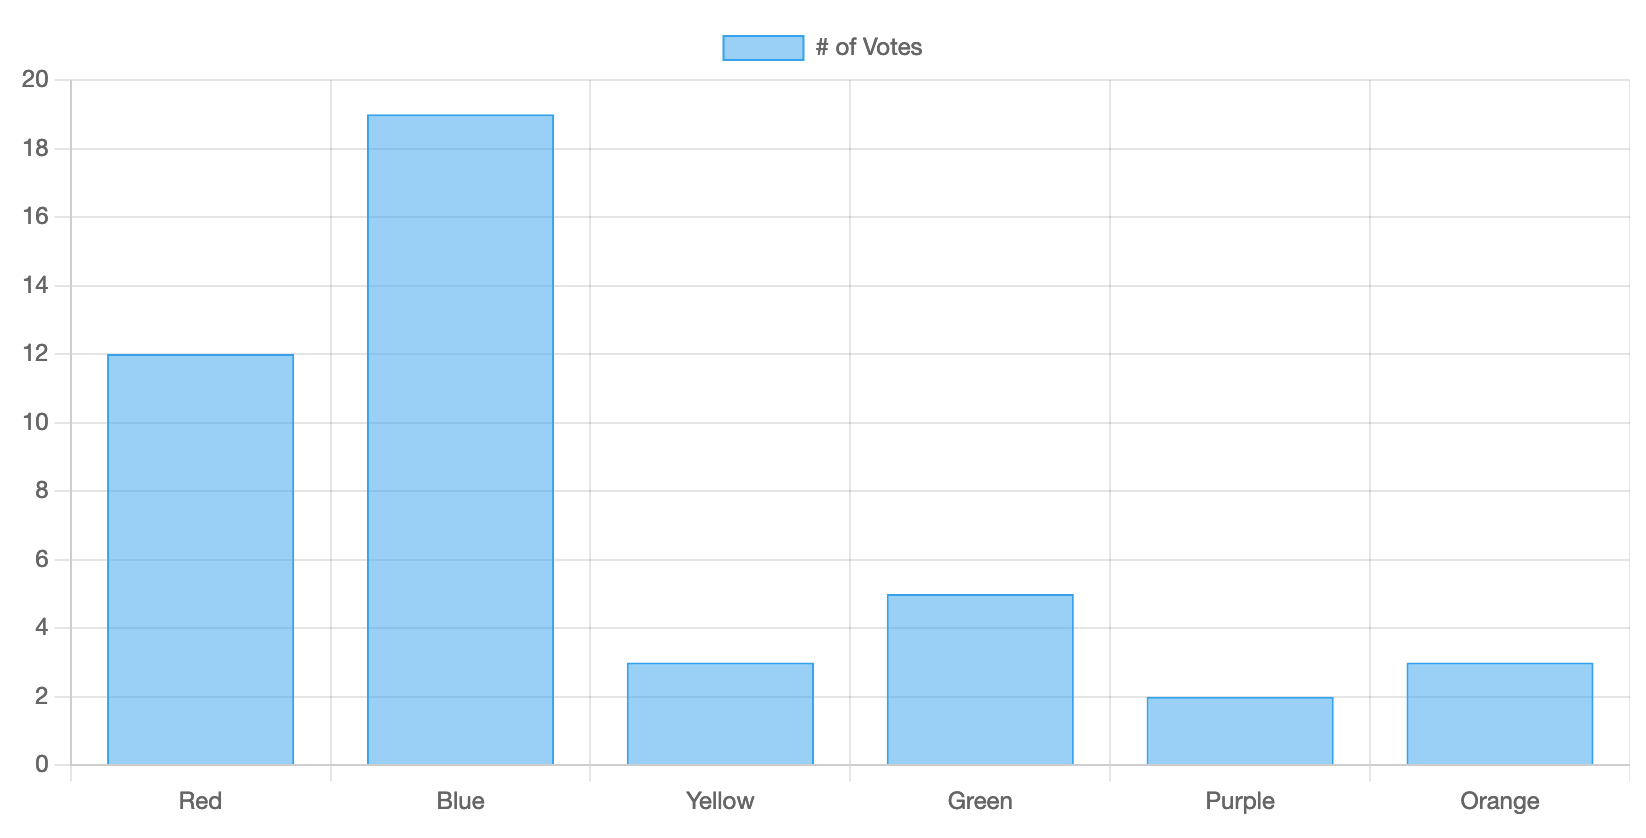
在此示例中,我们为单个数据集创建一个柱状图并将其渲染在 HTML 页面上。将此代码段添加到你的页面:
¥In this example, we create a bar chart for a single dataset and render it on an HTML page. Add this code snippet to your page:
<div>
  <canvas id="myChart"></canvas>
</div>
<script src="https://cdn.jsdelivr.net/npm/chart.js"></script>
<script>
  const ctx = document.getElementById('myChart');
  new Chart(ctx, {
    type: 'bar',
    data: {
      labels: ['Red', 'Blue', 'Yellow', 'Green', 'Purple', 'Orange'],
      datasets: [{
        label: '# of Votes',
        data: [12, 19, 3, 5, 2, 3],
        borderWidth: 1
      }]
    },
    options: {
      scales: {
        y: {
          beginAtZero: true
        }
      }
    }
  });
</script>
你应该得到这样的图表:
¥You should get a chart like this:
让我们分解这段代码。
¥Let's break this code down.
首先,我们需要在页面中有一个画布。建议为图表提供 responsiveness 自己的容器。
¥First, we need to have a canvas in our page. It's recommended to give the chart its own container for responsiveness.
<div>
  <canvas id="myChart"></canvas>
</div>
现在我们有了画布,我们可以从 CDN 中包含 Chart.js。
¥Now that we have a canvas, we can include Chart.js from a CDN.
<script src="https://cdn.jsdelivr.net/npm/chart.js"></script>
最后,我们可以创建一个图表。我们添加一个脚本来获取 myChart 画布元素并使用所需的配置实例化 new Chart:bar 图表类型、标签、数据点和选项。
¥Finally, we can create a chart. We add a script that acquires the myChart canvas element and instantiates new Chart with desired configuration: bar chart type, labels, data points, and options.
<script>
  const ctx = document.getElementById('myChart');
  new Chart(ctx, {
    type: 'bar',
    data: {
      labels: ['Red', 'Blue', 'Yellow', 'Green', 'Purple', 'Orange'],
      datasets: [{
        label: '# of Votes',
        data: [12, 19, 3, 5, 2, 3],
        borderWidth: 1
      }]
    },
    options: {
      scales: {
        y: {
          beginAtZero: true
        }
      }
    }
  });
</script>
你可以在 分步指南 中看到所有使用 Chart.js 的方法。
¥You can see all the ways to use Chart.js in the step-by-step guide.