# 插件
¥Plugins
插件是自定义或更改图表默认行为的最有效方式。它们已在 版本 2.1.0 (opens new window)(仅限全局插件)中引入并在 版本 2.5.0 (opens new window) 中进行了扩展(每个图表插件和选项)。
¥Plugins are the most efficient way to customize or change the default behavior of a chart. They have been introduced at version 2.1.0 (opens new window) (global plugins only) and extended at version 2.5.0 (opens new window) (per chart plugins and options).
# 使用插件
¥Using plugins
插件可以在图表实例之间共享:
¥Plugins can be shared between chart instances:
const plugin = { /* plugin implementation */ };
// chart1 and chart2 use "plugin"
const chart1 = new Chart(ctx, {
    plugins: [plugin]
});
const chart2 = new Chart(ctx, {
    plugins: [plugin]
});
// chart3 doesn't use "plugin"
const chart3 = new Chart(ctx, {});
插件也可以直接在图表 plugins 配置中定义(又名内联插件):
¥Plugins can also be defined directly in the chart plugins config (a.k.a. inline plugins):
警告
内联插件未注册。有些插件需要注册,即不能内联使用。
¥inline plugins are not registered. Some plugins require registering, i.e. can't be used inline.
const chart = new Chart(ctx, {
    plugins: [{
        beforeInit: function(chart, args, options) {
            //..
        }
    }]
});
但是,当自定义需要应用于许多图表时,这种方法并不理想。
¥However, this approach is not ideal when the customization needs to apply to many charts.
# 全局插件
¥Global plugins
插件可以全局注册以应用于所有图表(也称为全局插件):
¥Plugins can be registered globally to be applied on all charts (a.k.a. global plugins):
Chart.register({
    // plugin implementation
});
警告
内联插件无法全局注册。
¥inline plugins can't be registered globally.
# 配置
¥Configuration
# 插件 ID
¥Plugin ID
插件必须定义一个唯一的 id 才能配置。
¥Plugins must define a unique id in order to be configurable.
这个 id 应该跟在 npm 包名称约定 (opens new window) 之后:
¥This id should follow the npm package name convention (opens new window):
不能以点或下划线开头
¥can't start with a dot or an underscore
不能包含任何非 URL 安全字符
¥can't contain any non-URL-safe characters
不能包含大写字母
¥can't contain uppercase letters
应该是简短的,但也具有合理的描述性
¥should be something short, but also reasonably descriptive
如果一个插件打算公开发布,你可能需要检查 registry (opens new window) 以查看是否已经有该名称的东西。请注意,在这种情况下,包名称应以 chartjs-plugin- 为前缀才能出现在 Chart.js 插件注册表中。
¥If a plugin is intended to be released publicly, you may want to check the registry (opens new window) to see if there's something by that name already. Note that in this case, the package name should be prefixed by chartjs-plugin- to appear in Chart.js plugin registry.
# 插件选项
¥Plugin options
插件选项位于 options.plugins 配置下,并由插件 ID 限定范围:options.plugins.{plugin-id}。
¥Plugin options are located under the options.plugins config and are scoped by the plugin ID: options.plugins.{plugin-id}.
const chart = new Chart(ctx, {
    options: {
        foo: { ... },           // chart 'foo' option
        plugins: {
            p1: {
                foo: { ... },   // p1 plugin 'foo' option
                bar: { ... }
            },
            p2: {
                foo: { ... },   // p2 plugin 'foo' option
                bla: { ... }
            }
        }
    }
});
# 禁用插件
¥Disable plugins
要为特定图表实例禁用全局插件,插件选项必须设置为 false:
¥To disable a global plugin for a specific chart instance, the plugin options must be set to false:
Chart.register({
    id: 'p1',
    // ...
});
const chart = new Chart(ctx, {
    options: {
        plugins: {
            p1: false   // disable plugin 'p1' for this instance
        }
    }
});
要禁用特定图表实例的所有插件,请将 options.plugins 设置为 false:
¥To disable all plugins for a specific chart instance, set options.plugins to false:
const chart = new Chart(ctx, {
    options: {
        plugins: false // all plugins are disabled for this instance
    }
});
# 插件默认值
¥Plugin defaults
你可以在插件对象的 defaults 条目中为插件选项设置默认值。在下面的示例中,画布将始终具有浅绿色背景颜色,除非用户在 options.plugins.custom_canvas_background_color.color 中覆盖此选项。
¥You can set default values for your plugin options in the defaults entry of your plugin object. In the example below the canvas will always have a lightgreen backgroundColor unless the user overrides this option in options.plugins.custom_canvas_background_color.color.
const plugin = {
    id: 'custom_canvas_background_color',
    beforeDraw: (chart, args, options) => {
        const {ctx} = chart;
        ctx.save();
        ctx.globalCompositeOperation = 'destination-over';
        ctx.fillStyle = options.color;
        ctx.fillRect(0, 0, chart.width, chart.height);
        ctx.restore();
    },
    defaults: {
        color: 'lightGreen'
    }
}
# 插件核心 API
¥Plugin Core API
阅读有关 现有的插件扩展钩子 的更多信息。
¥Read more about the existing plugin extension hooks.
# 图表初始化
¥Chart Initialization
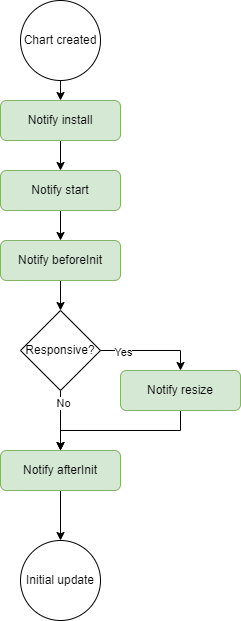
在初始化过程中通知插件。这些钩子可用于设置插件运行所需的数据。
¥Plugins are notified during the initialization process. These hooks can be used to set up data needed for the plugin to operate.

# 图表更新
¥Chart Update
插件在整个更新过程中都会收到通知。
¥Plugins are notified throughout the update process.

# 标尺更新
¥Scale Update
插件在整个秤更新过程中都会收到通知。
¥Plugins are notified throughout the scale update process.

# 渲染
¥Rendering
插件可以在整个渲染过程中与图表交互。渲染过程记录在下面的流程图中。每个绿色进程都是一个插件通知。红线表示当插件从钩子返回 false 时如何取消部分渲染过程。并非所有钩子都可以取消,但是,通常大多数 before* 钩子都可以取消。
¥Plugins can interact with the chart throughout the render process. The rendering process is documented in the flowchart below. Each of the green processes is a plugin notification. The red lines indicate how cancelling part of the render process can occur when a plugin returns false from a hook. Not all hooks are cancelable, however, in general most before* hooks can be cancelled.

# 事件处理
¥Event Handling
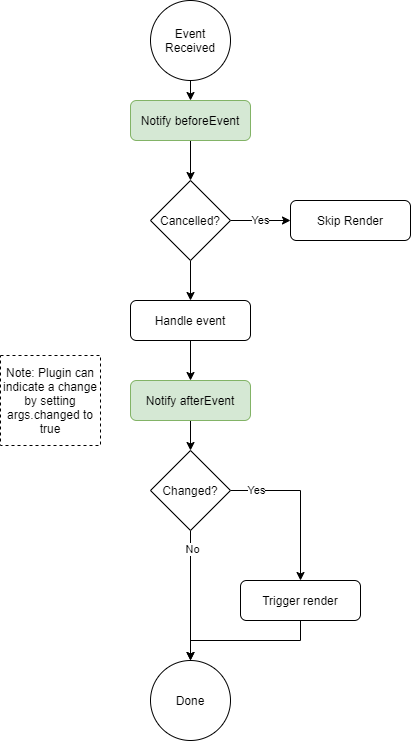
插件可以在事件处理过程中与图表进行交互。事件处理流程记录在下面的流程图中。每个绿色进程都是一个插件通知。如果插件进行了需要重新渲染的更改,插件可以将 args.changed 设置为 true 以指示需要渲染。内置工具提示插件使用此方法来指示工具提示何时更改。
¥Plugins can interact with the chart during the event handling process. The event handling flow is documented in the flowchart below. Each of the green processes is a plugin notification. If a plugin makes changes that require a re-render, the plugin can set args.changed to true to indicate that a render is needed. The built-in tooltip plugin uses this method to indicate when the tooltip has changed.

# 图表销毁
¥Chart destroy
在销毁过程中通知插件。这些钩子可用于破坏插件在其生命周期内制作和使用的东西。自 Chart.js 版本 3.7.0 以来,destroy 钩子已被弃用,请改用 afterDestroy 钩子。
¥Plugins are notified during the destroy process. These hooks can be used to destroy things that the plugin made and used during its life.
The destroy hook has been deprecated since Chart.js version 3.7.0, use the afterDestroy hook instead.

# TypeScript 类型
¥TypeScript Typings
如果你希望你的插件是静态类型的,你必须提供一个 .d.ts TypeScript 声明文件。Chart.js 通过使用 "声明合并" 的概念提供了一种使用用户定义的类型来扩充内置类型的方法。
¥If you want your plugin to be statically typed, you must provide a .d.ts TypeScript declaration file. Chart.js provides a way to augment built-in types with user-defined ones, by using the concept of "declaration merging".
添加插件时,PluginOptionsByType 必须包含插件的声明。
¥When adding a plugin, PluginOptionsByType must contain the declarations for the plugin.
例如,要为 canvas backgroundColor plugin 提供类型,你将添加一个包含以下内容的 .d.ts:
¥For example, to provide typings for the canvas backgroundColor plugin, you would add a .d.ts containing:
import {ChartType, Plugin} from 'chart.js';
declare module 'chart.js' {
  interface PluginOptionsByType<TType extends ChartType> {
    customCanvasBackgroundColor?: {
      color?: string
    }
  }
}